How much do U.S. product managers really make?
The rise of ICs, the unexpected salary dip for managers, why salary only moderately impacts satisfaction, and more revealing insights from our recent compensation survey.
👋 Hey, Lenny here! Welcome to this month’s ✨ free edition ✨ of Lenny’s Newsletter. Each week I tackle reader questions about building product, driving growth, and accelerating your career. If you’re not a subscriber, here’s what you missed this month:
Subscribe to get access to these posts, and every post from the past 5+ years. I guarantee that you’ll get a 100x return on the spend of this newsletter in terms of impact on your product and career—or your money back.
For more: Lenny and Friends Summit | Hire your next product leader | Top Maven courses | Lennybot | Podcast | Swag
I’m thrilled to share part two of the Lenny’s Newsletter Compensation survey results. I suspect this is the edition most of you have been waiting for: in-depth compensation benchmarks for product manager roles by level. Also, a few surprises. Credit to Louise Beryl for designing, analyzing, and articulating the most interesting findings from this (massive) survey. Also, a big thank you to Pave for helping us sanity-check these numbers.
Salary transparency is an increasingly important topic in tech, as professionals are keen to maximize their compensation, and companies are looking to hire and retain top talent. Many states have also recently passed pay transparency legislation in order to promote more equitable outcomes for workers across industries. With comp on everyone’s minds, we want to help U.S. product managers at all levels understand current salary trends and provide useful benchmarks to guide discussions and career planning.
We recently analyzed over 5,000 survey responses from Lenny’s Newsletter subscribers to answer the question: “How much do U.S. product managers really make?” We are focusing on U.S. product managers at all levels as they are one of the larger segments represented in this community (n=1,740). And we’re focusing on salary because our recent analysis revealed a strong preference for salary over equity when evaluating what matters most to professionals in their total compensation at the time of hire. In future articles, we will take a look at total comp, including equity and bonuses.
We uncovered a number of insights in the data, but the biggest and perhaps most unexpected theme is the rise of the IC career path. As product managers move up the ranks, salaries predictably increase, especially for individual contributors (ICs). But one surprising twist is that senior ICs often out-earn managers, challenging the assumption that management roles always pay more. This trend suggests that the value of ICs is rising, a shift further reinforced by recent layoffs disproportionately affecting middle managers, thus “flattening” organizations. As Mark Zuckerberg argued in 2023, and many other companies have followed suit, employees need to “get back to making things.”
All the insights that follow, drawn from those who are currently employed in full-time roles or have been within the past six months, shed more detailed light on salary benchmarks and other unexpected patterns in 2024.
Key trends in salary data
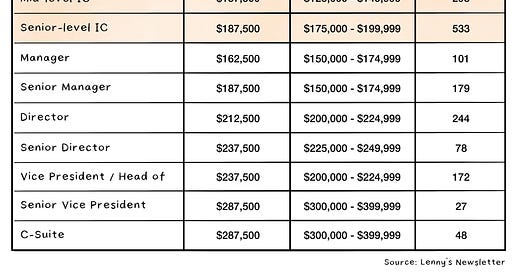
When it comes to analyzing and benchmarking compensation data, we learned that function, geography, and level have the biggest impact. Let’s dive into these trends and numbers (and make sure to check out the table below for reference):
1. ICs can achieve significant salary gains
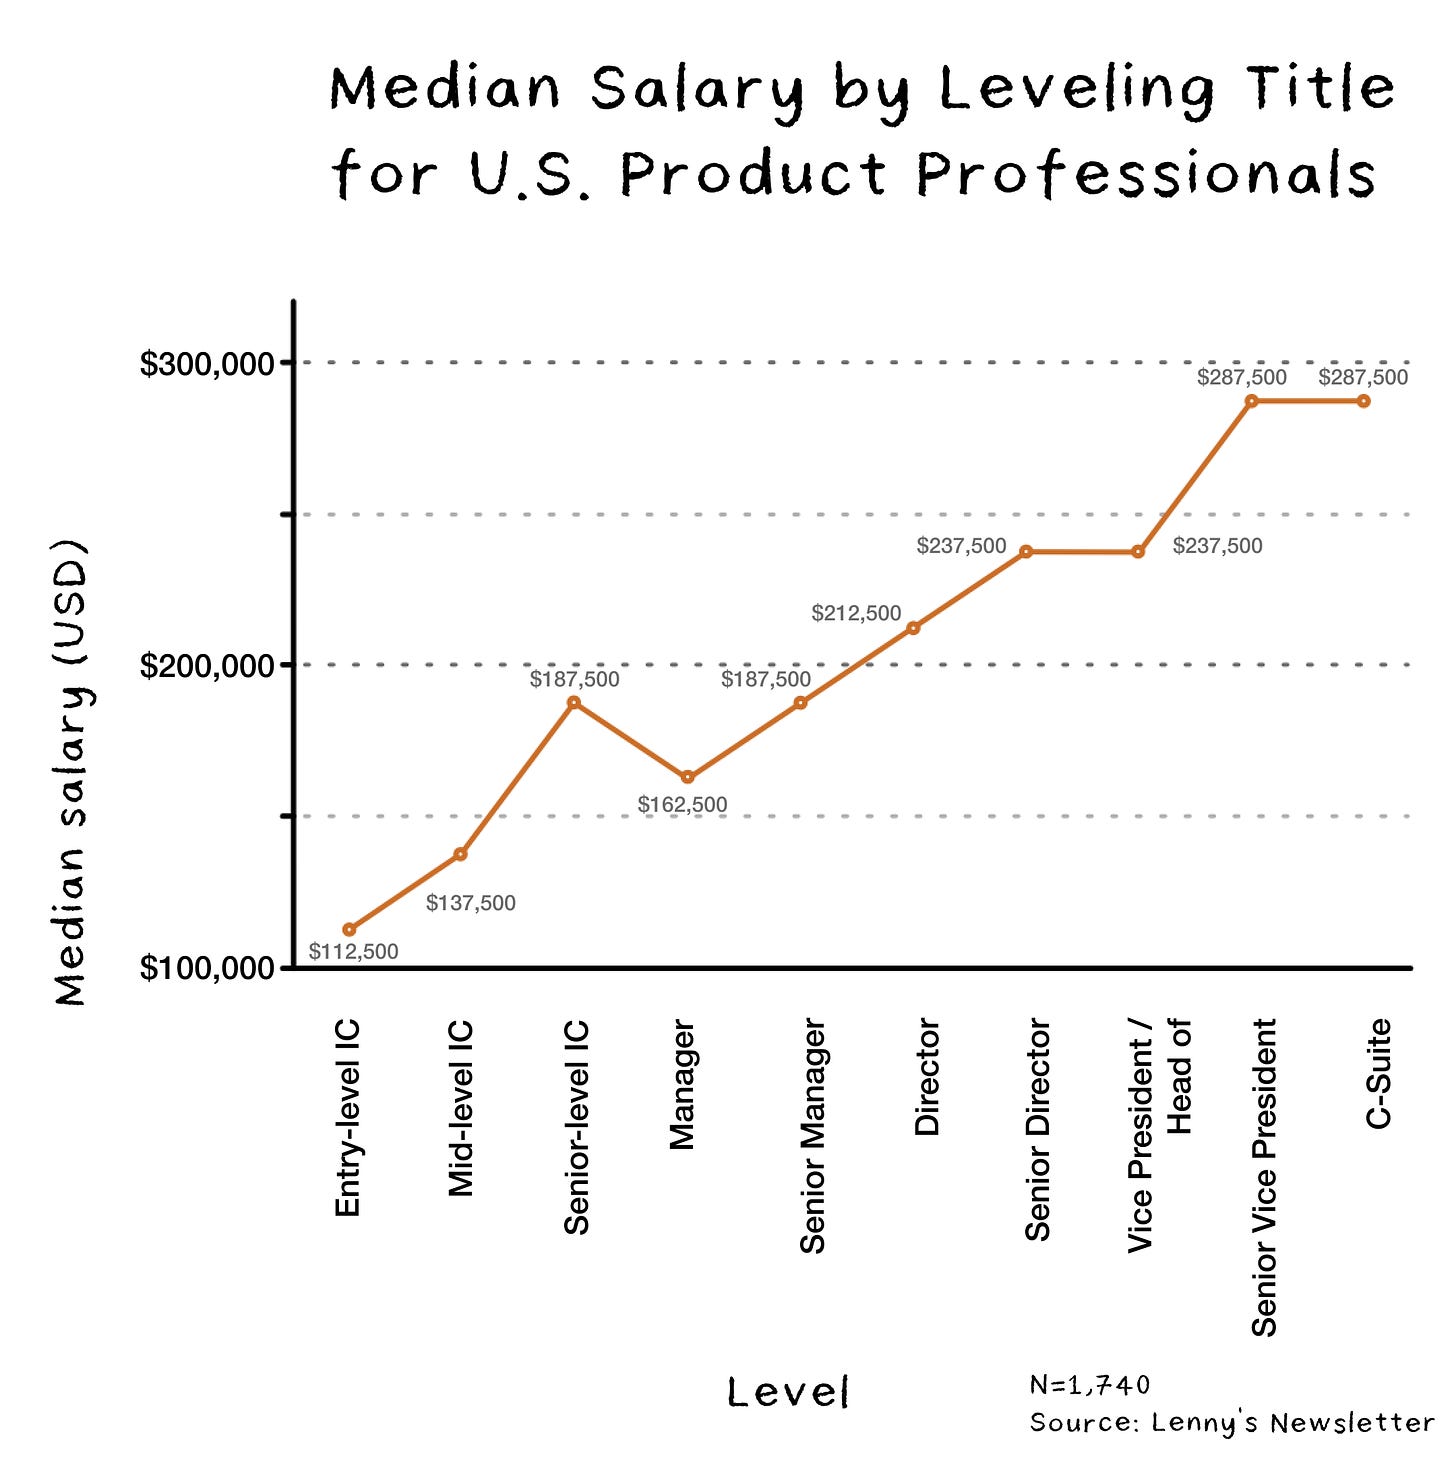
We found that leveling up within the individual contributor track can lead to significant pay gains. Entry-level ICs earn around $112,500 annually, but as they progress, mid-level ICs see an increase of $38,350 (median salary: $137,500), and senior ICs make $187,500—nearly $78,000 more than entry-level peers. These findings show that staying on the IC track can yield impressive salary growth, often matching or exceeding managerial compensation.
Does the company’s stage affect higher senior IC salaries? Yes and no. Among senior ICs at private companies, those earning in the 75th percentile or higher typically work at Series C or later-stage companies, which makes sense given that these companies have more funding to offer higher salaries.
However, when comparing senior ICs at private versus publicly traded companies, there isn’t a major difference in the percentage earning higher wages—33.44% at private companies versus 36% at publicly traded ones. This small difference is mainly due to a few senior ICs at publicly traded companies making $300K to $400K, a salary range not seen among private companies in our dataset.
2. There’s a surprising dip in salary at a manager level
One of the more unexpected findings was a salary dip when moving from senior IC to manager. When comparing median salaries, senior ICs significantly earn $26,920 more than managers (manager median salary: $162,500 vs. senior IC median salary: $187,500), which defies the common assumption that management roles always pay more.
Why? Many companies now recognize and value experienced ICs who can drive substantial impact. One senior IC, Tal Raviv, who appeared on a recent podcast with Lenny, offered this advice: “There’s a really good analogy here in engineering: … You shouldn’t have to rise into management in order to increase your compensation. You’re equally or just as valuable not as a manager [but] as a domain expert. And that’s step one, understand that you’re really, really, really valuable as an IC.” Check out the interview with Tal where he shares tactics for how he negotiates with recruiters to capture his market value.
Which level in management matches the numbers we see for senior ICs? Senior ICs are most closely matched to senior managers, particularly comparing quartiles and median salaries. That said, senior ICs still have a higher mode salary band of $175K to $200K compared with $150K to $175K for senior managers, and senior IC roles have a tighter salary range between the low and high points in the range than senior manager roles.
To be sure, more senior and executive levels of management outpace on average the senior IC roles surveyed here; nevertheless, the data reveal that senior ICs are well compensated for their high level of expertise.
3. Satisfaction is only moderately correlated with the total compensation package
Does money buy happiness, as the old adage goes? In our data, the correlation between total compensation package (salary, equity, and bonus) and satisfaction is 0.31, indicating a moderate positive relationship. This suggests that as compensation increases, satisfaction with total compensation also tends to increase, but the relationship is not overly strong, as you might expect. And interestingly, negotiating total compensation—which many believe would increase satisfaction—showed no significant impact on how satisfied respondents were with their overall compensation. Other variables within our dataset (gender, leveling title, years of experience, and company size) showed only a weak correlation to satisfaction with total compensation or no correlation at all, in the case of states within the U.S.
Benchmarks for base salary for U.S. product managers
Let’s further break down base salaries for U.S. product managers, starting with ICs and moving up through management and executive roles.
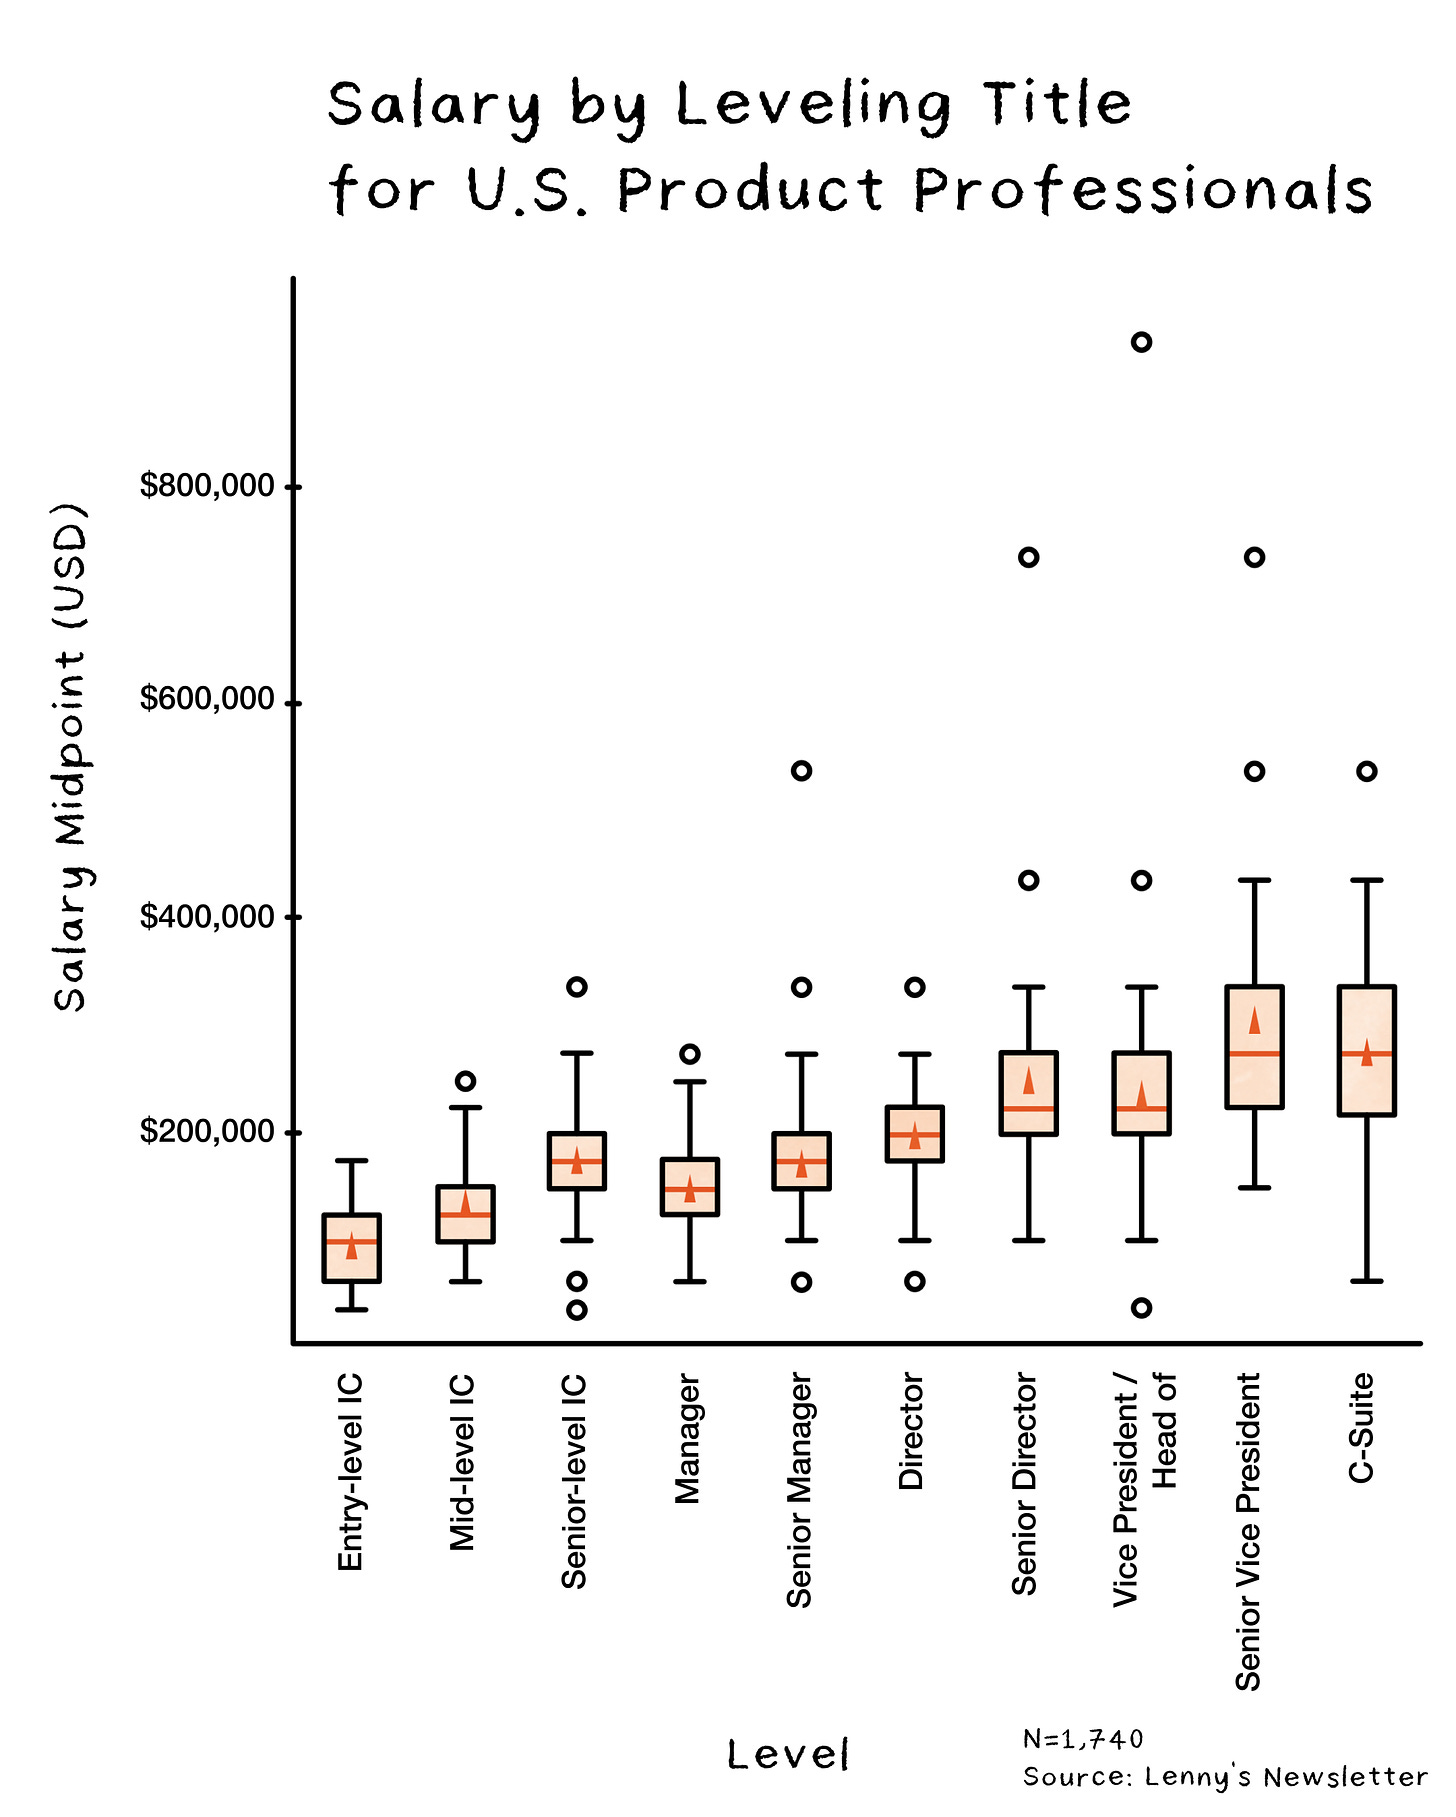
The box plot above shows where the bulk of our data lies and provides a snapshot of its spread and variability, making it easy to compare different datasets. Here’s how to interpret the key parts:
The “box” in each column identifies the interquartile range (IQR), which gives you a sense of how spread out the middle 50% of the data is. This can be more informative than just looking at the range (which is sensitive to outliers). The outer edges of the box identify the 25th percentile (meaning 25% of data points are below this value) and the 75th percentile (meaning 25% of data points are above this value).
The “median” is the line inside the box that marks the 50th percentile, or midpoint of the data. If it’s not centered, the data may be skewed higher or lower. The “arrow” inside the box identifies the average. It’s best to focus on the median instead of the average in box plots, because it is less affected by outliers and skewed data, providing a more accurate representation of the central tendency.
The “whiskers” extend from the box to the smallest and largest data points (that are not outliers) within 1.5 times the IQR, showing the overall range. The small “circles” identify the outliers beyond the whiskers and are plotted as individual points, highlighting unusual data values.
The box plot shows a wider distribution of salary midpoints for more senior roles (C-suite, VP, etc.), with outliers (the little circles) that push compensation into the $600,000 to $1M range. On the other hand, entry-level and mid-level ICs have far more consistent salary distributions, with less variance and fewer extreme outliers.
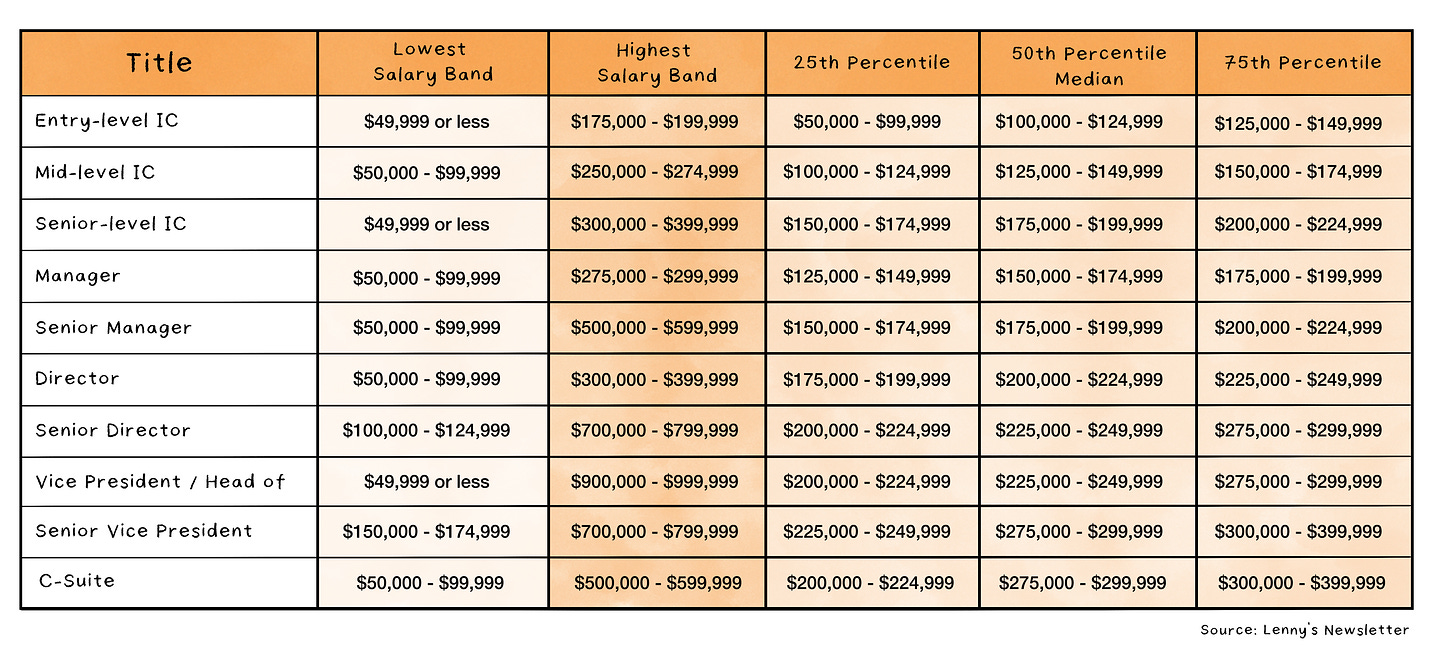
Below is a different view of the same data on the distribution of salary for U.S. product managers across levels. It shows key statistics, such as lowest and highest salary bands reported and percentiles, including the median salary band (or 50th percentile). For example, the C-Suite has a median salary band of $275,000-$299,999 and a wide salary range from $50,000-$599,999. In contrast, Entry-level IC roles have a median salary band of $100,000-$124,999 and a tighter salary range from $49,999 or less to $175,000-$199,999. The data highlights the progression of salaries across levels, with higher-ranking roles generally having higher medians and wider salary ranges.
How we created the benchmarks
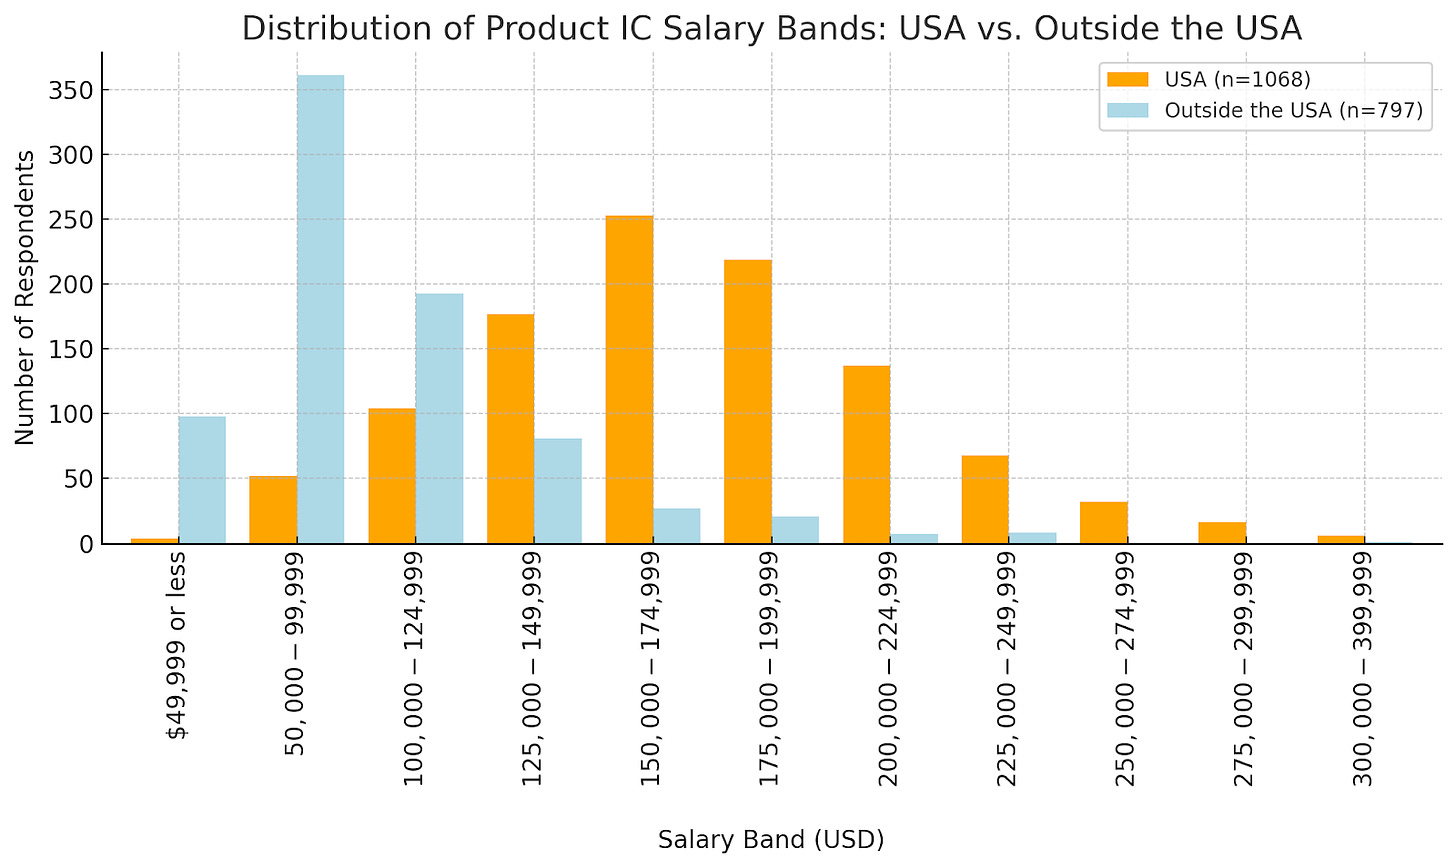
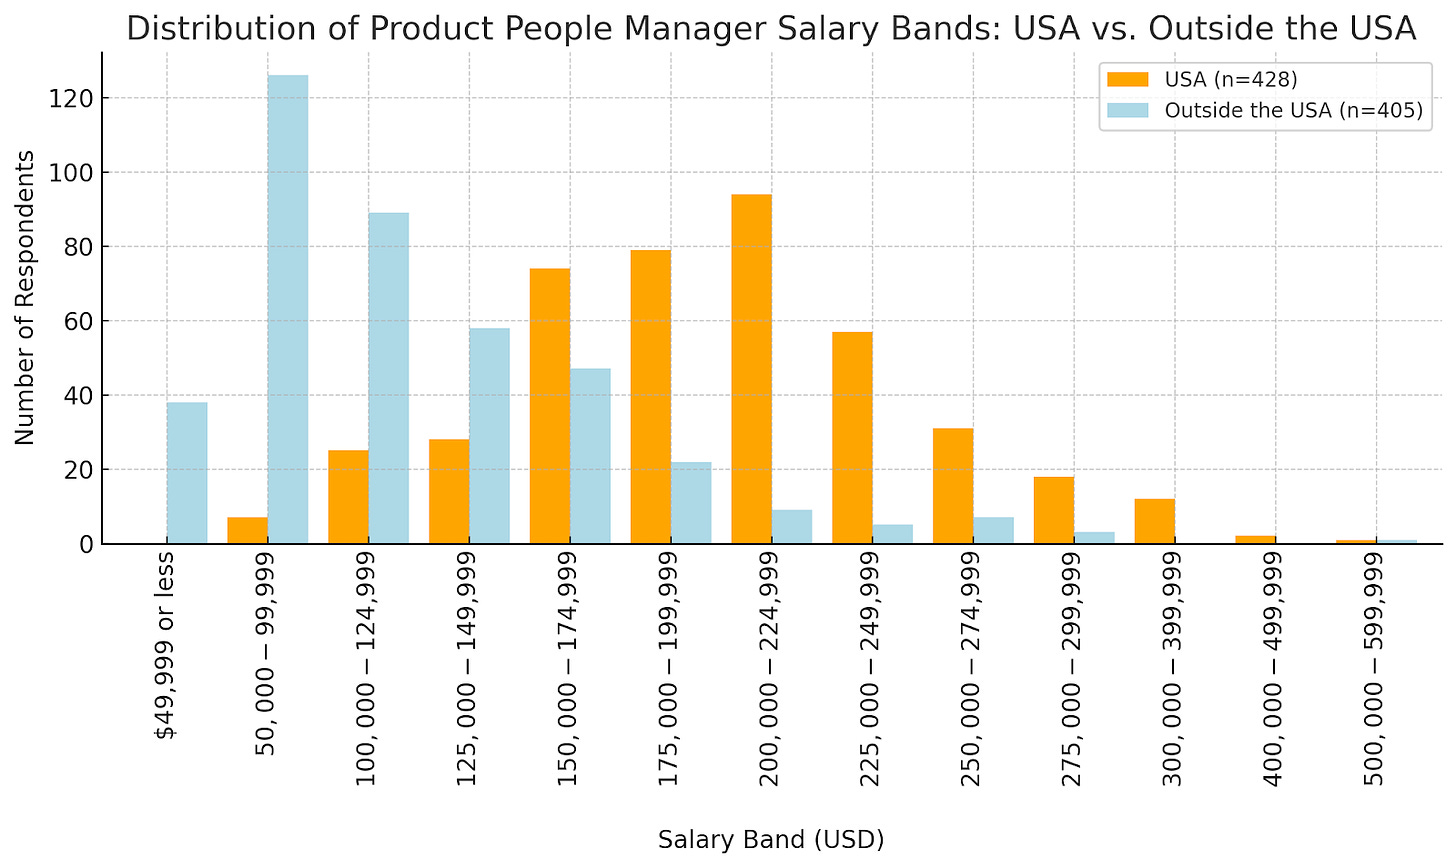
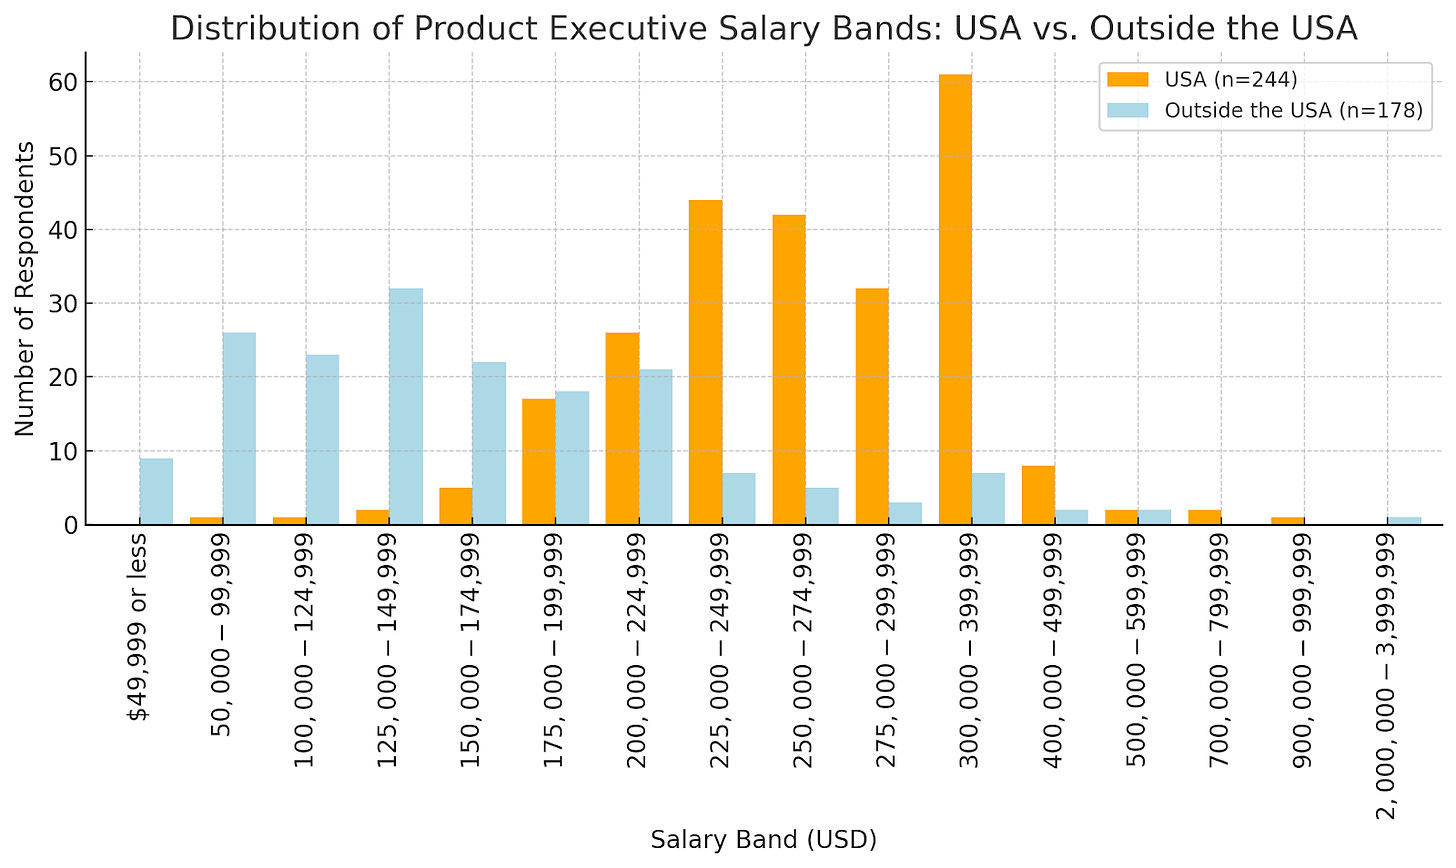
As we mentioned at the outset, function, geography, and level have the biggest impact on salary. At a high level, the charts below show the distribution of salary bands (annual cash only in USD, not including equity or bonuses) for product managers at three different levels—individual contributor (IC, does not oversee people), people manager (oversees ICs), and executive (oversees people managers)—and compares those who work from the U.S. to those who work outside of the U.S. Even with a quick glance, you can see how the U.S. salary bands (orange bars) skew higher than salary bands for those working outside of the U.S. (blue bars).
Job levels vs. years of experience: Years of experience—often assumed to be a major predictor of salary—is actually an anti-pattern when it comes to compensation. CEO Matt Schulman at Pave explains, “Here’s why: A product professional with 10 years of experience could be at an IC 5 level at one company and an IC 3 level at another. So saying, ‘This is how much someone with 10 years of experience makes’ implies a direct relationship between experience and compensation. But in reality, the more important relationship is between level and salary, and years of experience is only a correlated variable to job level.”
Standardizing levels through job titles: Levels are difficult to standardize across different companies and industries. Even among the big tech companies, levels don’t necessarily map one-to-one. In our survey, we addressed this challenge by creating a cascading hierarchy of job titles, and respondents were asked to select the leveling title that best represents their current (or most recent) position: entry-level IC, mid-level IC, senior-level IC, manager, senior manager, director, senior director, vice president / head of, senior vice president, or C-suite (CEO, chief product officer, chief technology officer, etc.). This proxy for job levels is not perfect, but it generates more valid and reliable data from which to create salary benchmarks, showing more granular differences among levels.
Takeaways for product managers
How can job seekers maximize salary?
For job seekers, the data shows that job level is one of the strongest predictors of salary. This means that if you want to increase your earnings, focus on advancing your role, whether through a higher IC level or transitioning to management. To do so, President of Product and Technology Tamar Yehoshua (of Slack, Google, Amazon, and Glean) suggests in her chat on Lenny’s Podcast not focusing on which company is going to pay you the most but rather finding companies that have a “nexus of great people” where you’re going to learn the most. She also emphasizes the importance of “moving the business forward” (as opposed to hitting your goals or demonstrating skills at the next level): “One of the things that I think is overlooked is, do a really good job at whatever your job is at that point … however simple, however easy it may be for you, do a great job.”
However, don’t assume that management always means higher pay—according to our data, senior ICs often out-earn managers. If you’re an experienced IC and enjoy it, leverage your expertise to negotiate a strong compensation package without feeling pressured to move into management. Senior IC Tal Raviv suggests in his chat on Lenny’s Podcast that advocating for more differentiated senior IC titles at your company to create that career path, and thus compensation progression, for yourself (and others): “I think having good titles that are clear that you can move up into, first of all, creates an idea that there is progress. Creating clear levels and rubric just like you would for within any level or within any title, saying it out loud, recognizing it. At the end of the day, we all want respect, we all want to feel that we’re growing, we all want to feel that we’re recognized. So I think putting it into words goes a really long way.”
That said, our data highlights that salary isn’t everything. While higher compensation is moderately correlated with job satisfaction, negotiating for more money won’t necessarily make you happier in your role. Consider other aspects of your compensation package, such as equity, benefits, and work-life balance, to maximize overall satisfaction.
How can employers attract and retain talent?
For employers, understanding the value of experienced ICs is crucial. Senior ICs play vital roles in driving product success and can command salaries that rival management roles. Offering competitive salaries and clear growth paths for ICs can help attract and retain top talent, especially in a market where specialized skills are increasingly valued.
Finally, as pay transparency laws continue to spread, it’s important to provide clear and competitive salary information in job postings. This not only builds trust but also ensures that your company remains competitive in attracting the best talent.
By focusing on the job level and offering a well-rounded compensation package, both job seekers and employers can create win-win scenarios in today’s competitive market.
What’s next
For round three, we plan to team up with Pave, domain experts in the compensation space, to share data (including equity and bonus benchmarks) and trends related to this segment and others. Make sure you’re subscribed to the newsletter to avoid missing future posts in this series.
Thanks, Louise! Have a fulfilling and productive week 🙏
Hiring? 👀
I’ve got a white-glove recruiting service specializing in senior product roles (e.g. Directors, VPs, and Heads of Product), where I work with a few select companies to fill their open roles. If you’re hiring, apply to work with us below.
If you’re finding this newsletter valuable, share it with a friend, and consider subscribing if you haven’t already. There are group discounts, gift options, and referral bonuses available.
Sincerely,
Lenny 👋





Great data! I know this doesnt include equity, but any idea if this is just base salary OR full comp (insurance, retirement matching, etc.). As a hiring manager...Im sometimes surprised when an employee brings me results like this. Kudos to them for doing their research! But it can be tough to turn around to HR and try to get an somebody bumped up and the response from HR is "when we look at full comp they are in range".
This data *feels* right. Every now and then I'll see a post on LinkedIn from product thought leaders on getting roles at 300K+ and I sit and go "what am I missing?"
The Mid-level to senior IC role makes complete sense to what I've seen for myself and peers.
I agree with @darinwonn in their take below that I'm curious if it's base salary OR full comp. I assume base salary though just from the numbers comparison.