How Duolingo builds product
Cem Kansu on Duolingo’s unique team structure, steady planning cadence, design review process, OKR templates, team rituals, and more
👋 Hey, I’m Lenny and welcome to a 🔒 subscriber-only edition 🔒 of my weekly newsletter. Each week I tackle reader questions about building product, driving growth, and accelerating your career.
On the heels of what is now my second most popular post of all time (How Duolingo reignited user growth by Jorge Mazal 🔥), I’m excited to share a deep dive into the day-to-day workings of how Duolingo builds product.
This post is part three of an ongoing series on how the best product teams build product (don’t miss Figma and Coda), and I’m especially excited to share this because, as you probably noticed in Jorge’s post, Duolingo has a unique approach to most things 😮
I sat down with Cem Kansu, VP of Product at Duolingo, to learn about the company’s fascinating org structure, planning cadence, design review process, approach to OKRs, team rituals, goals, and much more. And per usual, you’ll find plenty of templates, real-life examples, and inspiration for your own team.
A big thank-you to Cem for answering all of my questions. For more, make sure to follow Cem on LinkedIn and Twitter. Enjoy!
How Duolingo builds product
with Cem Kansu
1. How is your product org structured? And how has this evolved over time?
Our product teams are cross-functional—people from multiple functions (e.g. design, engineering, learning science, marketing, PM) work on the same team. The team is managed by two or three “co-leads.” Typically, a PM lead and an Engineering lead head up the team, sometimes joined by a Learning and Curriculum lead (experts in learning science, curriculum design, and educational content creation), Biz Ops lead, or Marketing lead, depending on what the team is working on.
Team co-leads are ultimately responsible for their team’s success and deciding its roadmap. They also own the decisions in their domain. For example, the PM co-lead owns more of the product discovery and roadmap decisions, whereas the engineering lead owns more of the product delivery and implementation decisions.
When I joined Duolingo in 2016, the company had three PMs and only engineers as team leads. As we started building out the PM team, leadership saw value in having PMs as team leads. We piloted the co-lead structure with PMs and engineers and saw two main benefits:
PM and engineering brought complementary skills to team leadership, bringing together business acumen with technical expertise. Together, they were more effective than one lead from either function.
Division of leadership responsibilities made it easier to run a team. Having co-leads enabled them to split responsibilities and reduce the time invested to lead a high-performing team.
Today, almost all of our product teams have the co-lead structure.
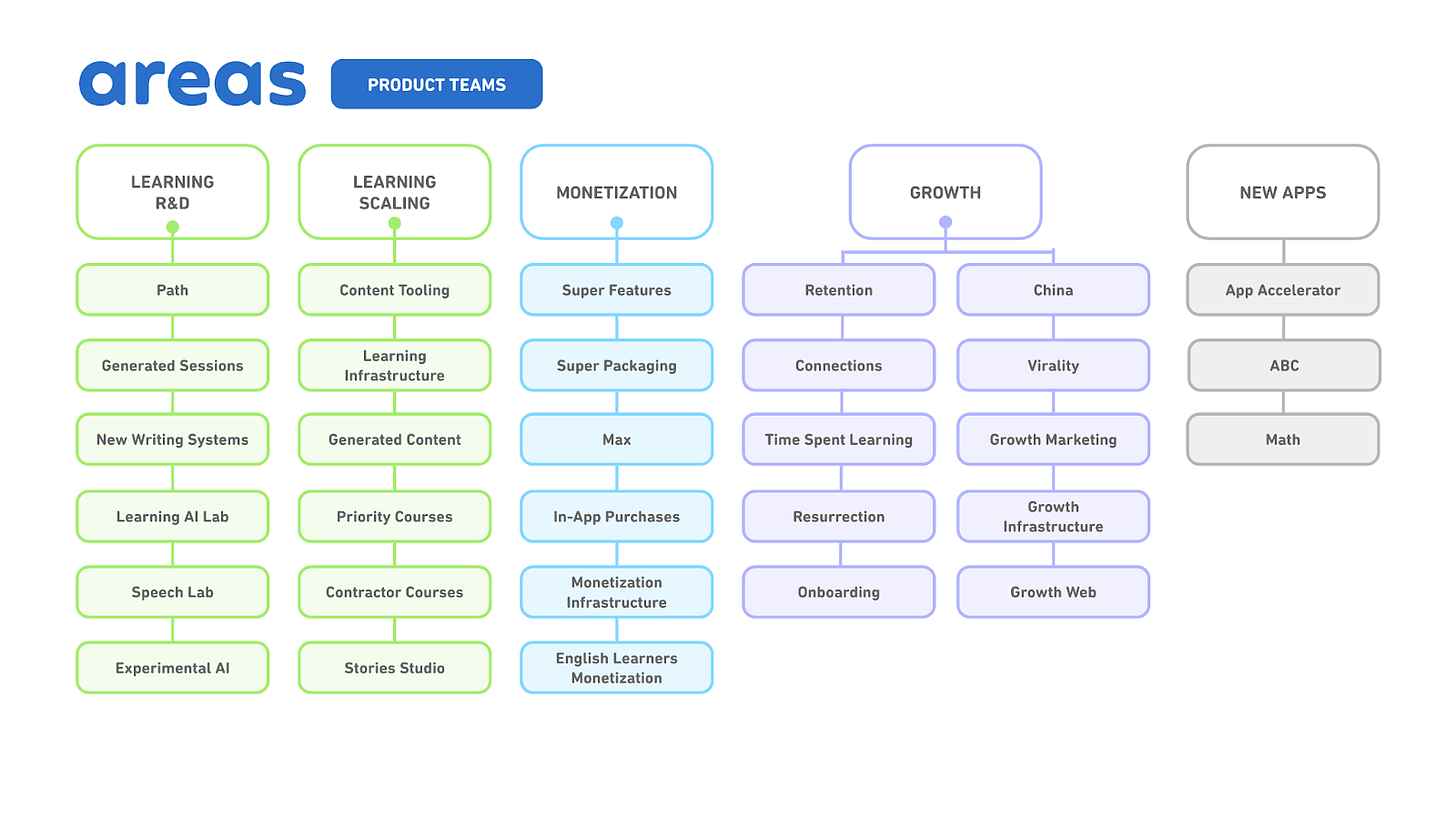
Zooming out, all Product teams are part of “areas.” An area is a group of product teams that share common business goals. Similar to individual teams, areas also have cross-functional co-leads (Engineering, PM, and other roles, like Marketing).
Here is the current list of product areas and the teams within them:
While all of our teams are metrics-driven, we tend to structure product teams as either (1) metric-based or (2) feature-based. Metric-based teams are structured around clear metrics that impact something the company wants to improve, like revenue or DAUs. For example:
The In-App Purchases team owns the metric of in-app purchase (IAP) revenue. They are part of the Monetization area. The Monetization area owns the metric Duolingo app revenue, which is the sum of IAP, ads, and subscription revenue.
The Retention team owns the metric current user retention (CURR) and is part of the Growth area. The Growth area owns the metric of DAUs, which is heavily influenced by CURR.
Feature-based teams are defined by the product problem we want to solve, and in most cases there isn’t a good metric that can accurately quantify success. For example:
The Connections team owns all social features within Duolingo. We know that in the long term having a more social experience within Duolingo is good for our growth because it makes language learning fun and accelerates word-of-mouth growth. So instead of focusing on driving a metric, the team is focused on “making Duolingo more social” and is part of the Growth area.
The Path team aims to improve a learner’s navigation within Duolingo, and their mission is to create a “path” for learners that maximizes learning efficacy and makes Duolingo engaging. They help Duolingo teach better by creating more efficient and fun ways for learners to go through lessons. There’s no clear metric that captures this, so the Path team focuses on their mission to build their roadmap.
Obviously it’s harder to measure success with feature-based teams, but we’ve learned to work with that. We use a combination of qualitative and quantitative signals to see if we are tracking toward success, which looks different depending on the feature. For example, to measure how we are “making Duolingo more social,” we would use a few signals to decide if we are making progress:
Usage of features by Duos (Duolingo employees) and buzz around the features we are building. In other words, we look for how much Duos care about our features.
Most of us use Duolingo daily and have long streaks. It’s always a good sign if Duos are actively using and talking about a feature.
User research studies on the features we are building.
Signals from public forums like Reddit and Twitter to see how our users are reacting to our features.
Results from long-term holdout experiments, where we launch the experiment condition to the majority of our users and hold a small percentage in the control condition for a long time (more than three months). Social features have long-term effects, since it takes time for learners to add friends and have meaningful interactions. We measure these effects with holdout experiments.
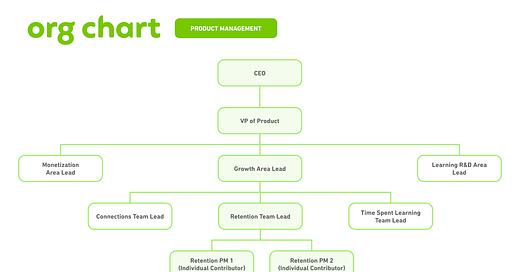
In terms of our reporting structure for product management, here’s a chart that displays what it looks like for PMs on the retention team, which is part of the growth area:
In our org structure, all of Product Management, Product Ops, and UX Research are part of Duolingo’s larger Product organization, and they report up to me. I report to our CEO.
All of Design reports into our VP of Design (Simmy). All of Engineering reports into either the Chief Technical Officer (Severin) or Chief Engineering Officer (Natalie), and they report to our CEO.
2. Do you use OKRs in some form?
We use quarterly OKRs that have been tailored around what we’ve seen work at Duolingo. Today our quarterly OKR development process is a three-step process that takes about three weeks. Here’s an example of what the planning cycle for Q2 would look like:
2 weeks before end of Q1: Teams grade their Q1 OKRs and draft Q2 OKRs
Team leads lead this process. They collaborate with area leads and other relevant leaders, and work with their team members to write their draft OKRs.
In the course of a week, they collect feedback and iterate on their first draft to finalize team OKRs.
1 week before end of Q1: Areas grade their Q1 OKRs and draft Q2 OKRs
Using team OKRs as their main input, area leads draft their Q2 OKRs for their area.
In the course of a week, they collect and incorporate feedback from senior leadership as they iterate from first draft to final draft.
First week of Q2: Companywide OKR reviews with senior leadership
Area leads present the final version of their OKRs to senior leadership.
All OKR reviews are done in the first week of the quarter.
Any feedback and proposed changes are incorporated ASAP after the review meetings, and final OKRs are published to the company by the end of the first week of Q2.
We follow this OKR timeline closely but not super-strictly. In reality, the team and area OKRs happen in parallel. For example, areas would start writing their first draft when they review the first version of team OKRs. The only part we are strict about is the companywide OKR reviews with senior leadership always being on the first week of the quarter, as that keeps us on schedule.
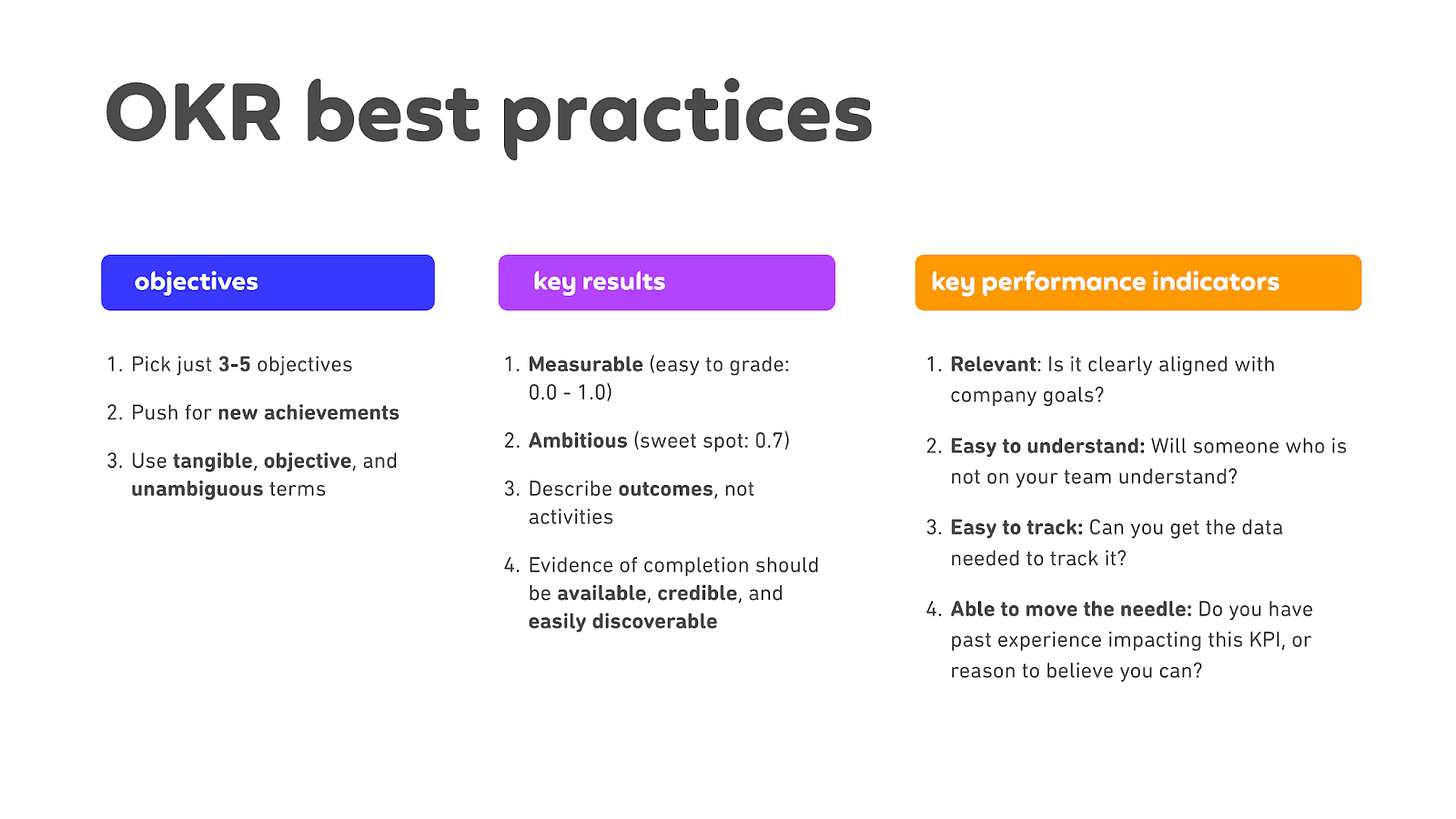
In writing OKRs, here is a summary of the best practices we follow:
In the end, our OKRs will end up looking something like this for a product area—this would be an example of a revenue-based set of OKRs (numbers are made up):
We’ve had quarterly OKRs for as long as I can remember, but as the number of product teams grew, we evolved the process to match our needs. In the earlier days, when Duolingo had only a few product teams, OKRs were simply product teams writing their OKRs down on a spreadsheet and getting feedback from senior leaders to finalize. The whole process took a few days.
As we created many product teams, this became unmanageable because it wasn’t feasible for leadership to review and have valuable input on every team’s OKRs. Then we changed our process to what we have now, where teams finalize their OKRS within areas, and areas present OKRs to senior leadership. We believe in giving latitude to product teams to do what they think is right and empowering PMs to set their own strategy. Having this two-step OKR process with area and team OKRs helped us have clear alignment on team priorities while giving autonomy to teams.
We’ve kept the time invested in OKR planning to a reasonable minimum by keeping each step to one week. The reason for this being: time spent planning OKRs is time taken away from making progress on our OKRs, but good OKR planning is critical to making sure we work on the right things. So balancing these two goals has been core to how we’ve evolved OKRs.
3. How far out do you plan in detail?
We have two main planning cycles: quarterly OKRs for all teams/areas (described above) and yearly OKRs for the whole company.
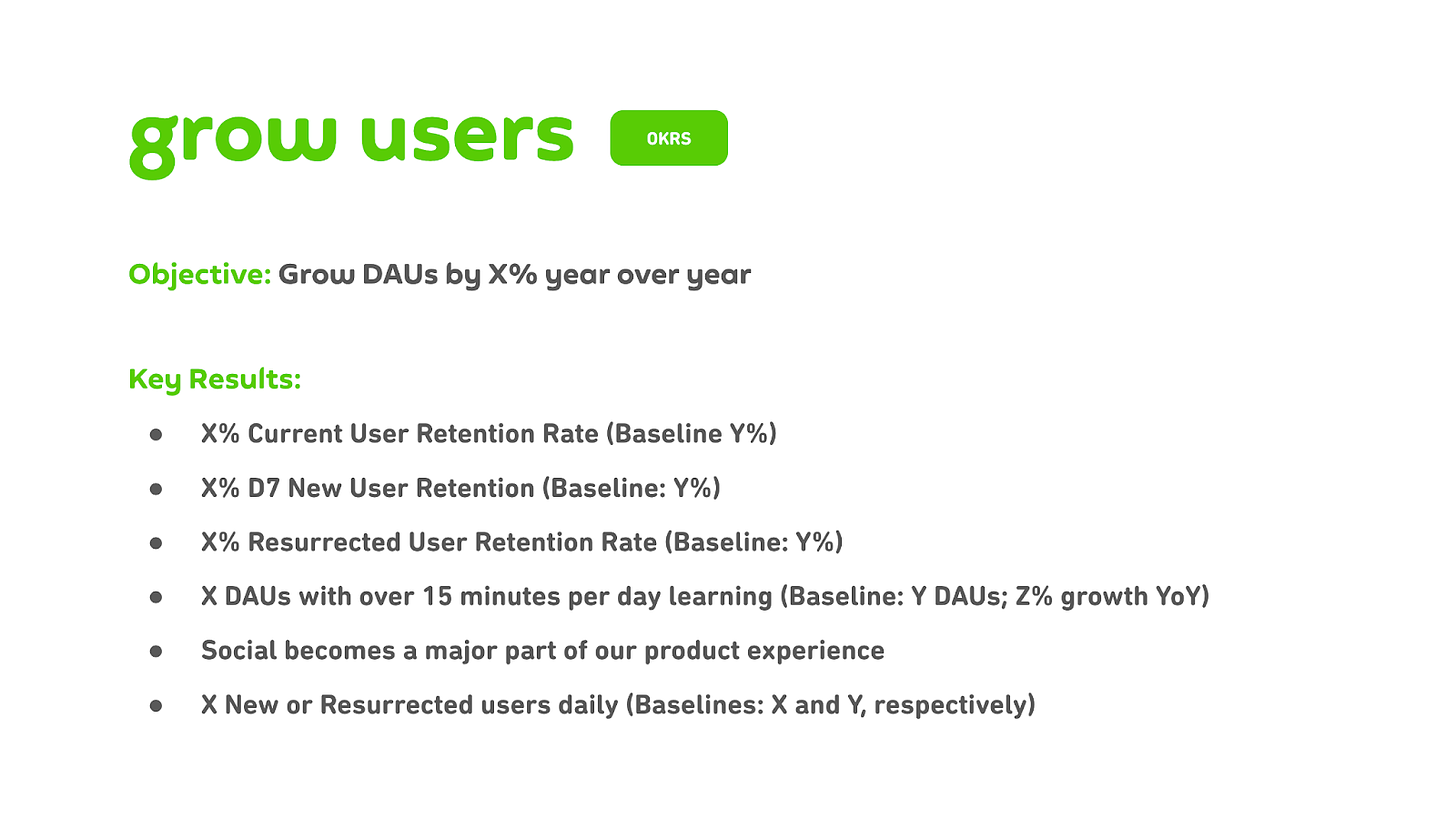
For the yearly OKR process, around October each year the senior leadership team comes together to set the company OKRs for the next calendar year. The yearly company OKRs define our biggest strategic bets and highest-priority investments for the next year. Here is an example screenshot of what our company OKRs looked like for 2022 for DAU growth (numbers are X’ed out):


