Demand driving supply: The little-understood growth loop behind a surprising number of iconic billion-dollar companies
Guest post by Brian Rothenberg, Partner at Defy.vc, former VP of Growth at Eventbrite, and two-time founder
👋 Hey, Lenny here! Welcome to this month’s ✨ free edition ✨ of my newsletter. Each week I humbly tackle reader questions about product, growth, working with humans, and anything else that’s stressing you out about work. If you’re not a subscriber, here’s what you missed this month:
Subscribe to get this newsletter every week 👇
Book of the month: The Cold Start Problem, by Andrew Chen
Did you know that Andrew Chen has a book coming out?? Yes, the same Andrew Chen who’s written some of the most well-known growth essays out there (and who for the past three years has been working on this book instead of blogging):
I’ve read a preview copy of Andrew’s book, and I can tell you it’s very good. It’s full of real-life examples, actionable advice, and concrete takeaways (basically, all the same reasons you subscribe to this newsletter). Pre-order now to make sure you get a copy as soon as it ships 👇👇👇
On to this week’s post…
Q: I’ve noticed that some of my customers end up signing up to become “supply” in my marketplace, which helps me grow the marketplace faster. Amazing! Any advice for leaning into this behavior?
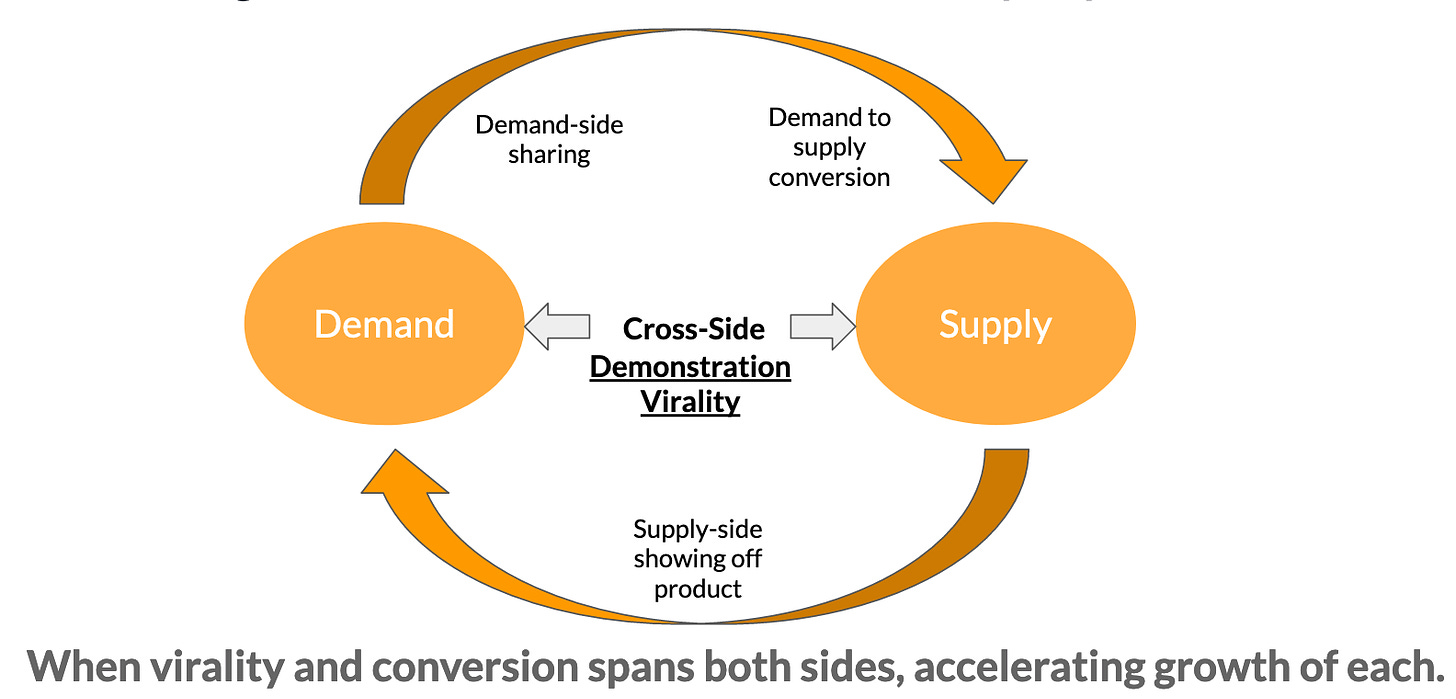
Marketplaces have the most interesting growth loops. Your supply can drive your demand, your demand can drive your supply, demand can drive more demand, and supply can drive more supply. What a world! If you can find, nurture, and accelerate one or two of these loops, you’ll find a powerful new growth lever that your competition may not have.
To study the growth loop you’ve identified within your business—where your demand is directly driving your supply—I’ve pulled in Brian Rothenberg, who presented a memorable talk on this very topic at a recent conference. Brian has spent the past 15 years starting, growing, and investing in marketplaces, and he personally founded two marketplace startups. He also led customer acquisition at TaskRabbit, spent over six years scaling Eventbrite to its IPO as VP of Growth, and is now a Partner at Defy. We’re lucky to have him share his insights, and I hope you find this as informative as I did.
For more from Brian, you can find him on Twitter, LinkedIn, and his website.
Demand driving supply
by Brian Rothenberg
A surprisingly large number of iconic billion-dollar-plus companies—including Airbnb, DocuSign, Uber, Lyft, Square, Eventbrite, GoFundMe, and SurveyMonkey—share a unique and little-understood growth loop: demand driving supply.
In Lenny’s post “Magical growth loops,” he shares several examples of this in action. For instance, Lyft:
Lyft gets a new rider
This rider takes a ride, meets the driver, and gets excited about driving
The rider becomes a driver
Lenny and I have discussed this dynamic with other growth leaders, but there hasn’t been much written about how these companies have actually attacked this opportunity. In this guide I’m going to share my learnings around how to identify this powerful growth loop, how to determine whether it can benefit your business, and how to use it to power your own organic growth.
To help bring this to life in the most tangible way possible, I’m going to explore a specific demand-driving-supply growth loop that we identified and successfully amplified during Eventbrite’s startup to scale-up days:
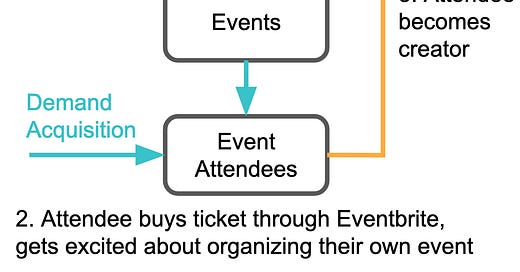
Eventbrite recruits an event creator
An attendee buys ticket(s) to the event through Eventbrite and gets excited about organizing their own event
The attendee becomes a creator
At Eventbrite’s IPO, this viral loop was important enough to be listed as the first of four key components of our GTM strategy. From our S-1:
A significant number of creators become aware of us through either word of mouth or interacting with our platform as attendees. In a 2016 internal survey of more than 3,000 global creators, 36% of creators reported first learning about Eventbrite through word of mouth and 34% of creators reported first learning of Eventbrite by attending events produced by other Eventbrite creators. Both of these factors have helped us grow organically with low creator acquisition costs.
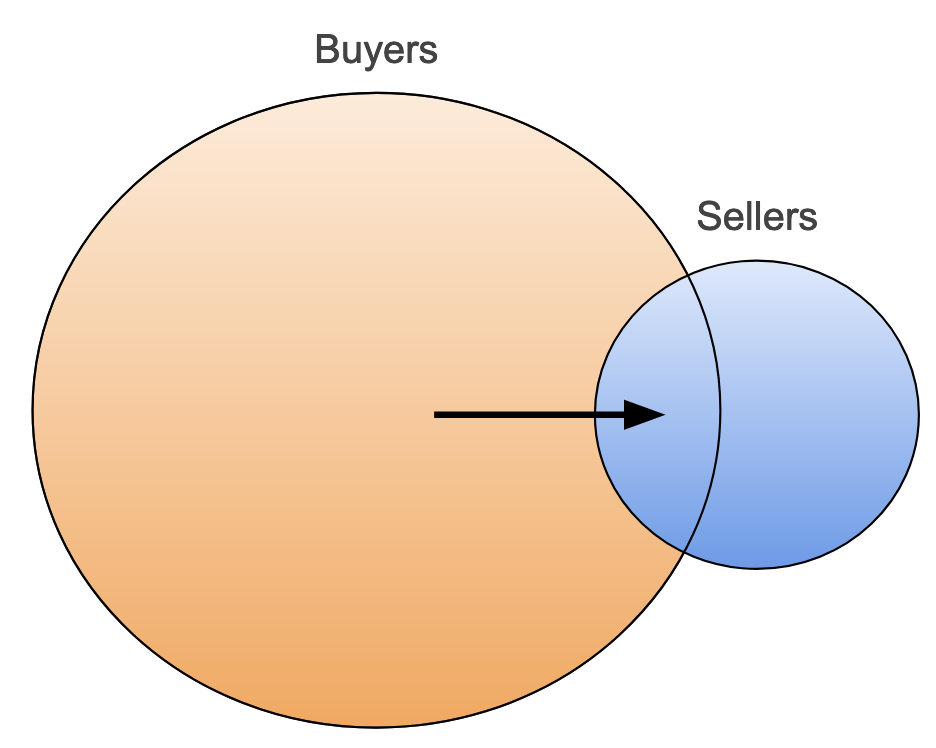
Other hugely successful startups have benefited from this built-in dynamic as well. For example, former Square COO Keith Rabois once shared that in the early days, approximately 1% of people who bought through the Square reader (demand side) later became Square merchants (supply side), becoming a powerful viral distribution mechanism for Square. As Square added more merchants, those merchants shared Square with more buyers, of which a portion of buyers converted into merchants, and so the flywheel spins. Fast-forward to today, and Square is valued at around $120 billion.
How to identify this growth dynamic
Eventbrite’s Series A investor and board member Roelof Botha from Sequoia Capital first saw this growth opportunity in his diligence process and talked about it in a 2009 TechCrunch interview with Kevin and Julia Hartz (13:01 in video):
Building on anecdotes and qualitative evidence that buyer-to-seller conversion was already happening even at a very early stage, early employees Felicia Evans, Tamara Mendelsohn, Nels Gilbreth, and others conducted important preliminary data analysis, research, and initial experiments to further vet the opportunity for this growth loop. After I joined as Eventbrite’s first head of growth, our initial growth team chose to prioritize this as our top area for experimentation. Given our existing attendee-to-creator conversion, we hypothesized that we could materially increase this rate of conversion, and our modeling showed that doing so could provide a material lift to our organic growth.
If you’re thinking about exploring this viral loop for your business, my number one piece of advice is to first see if it’s already happening. Only lean into it if you’re already seeing this behavior, rather than trying to force it from a cold start.
How?
Start by looking at your data, to see if demand-to-supply conversion is already happening (e.g. Lyft riders converting to drivers). How many and what percent of your supply side first interacted with your product as demand-side users?
This can start small at the earliest stages of your company. A seed-stage company I recently evaluated as a potential investment has just 38 sellers on its platform, but five of them started out as buyers on the platform. This at least gives me some early indication that this powerful demand-to-supply growth loop could emerge as a future growth driver. A small sample size is OK to start; you just want to see evidence that it’s happening organically.
What kind of conversion rate should I be looking for?
I’ve asked friends at companies that have experienced this demand-to-supply loop what they’ve seen in terms of conversion rates. I’ve heard a pretty broad range, from roughly 0.5% to around 5% of users, starting as demand-side users and then converting to supply-side users. But I have seen rare companies with even higher rates. For example, Aalto (disclaimer: I’m an investor), a new real estate marketplace that connects homeowners and buyers directly, is moving substantial volume in part because 11% of buyers who join (to access Aalto’s exclusive housing inventory) also want to sell via its streamlined sales experience.
While there are cases of double-digit conversion rates, it’s more likely to be a relatively small percentage that you can expect to convert. Because the conversion rate tends to be small, this loop is often more apparent and becomes a more powerful lever as the demand side of your business increases in scale. In the earliest days, when your startup has just hundreds or single-digit thousands of demand-side users, this may not materially move the needle in terms of supply-side growth. Where it becomes really powerful is when the volume of demand-side users ramps up into the hundreds of thousands and millions. It’s around this time when the data will tell you some interesting things.
For many businesses with this demand-to-supply dynamic, there tends to be some latency. As such, I’d start by looking at the following:
Buyer-to-seller conversion rates in the first month, after the second month, and so on. Again, to start you are primarily looking to see if it’s happening even at very small numbers, say 0.1%. Then I’d suggest looking at whether this conversion rate holds constant, or ideally increases, over time. In the example chart below, looking at the blue line you can see that for Eventbrite some percent of attendees created their first event (became the supply side) in the same month that they bought a ticket. That percentage then grows after the first month (red line) and again after the second month (green line). So from this analysis we learned that demand-side users converted in the same month in which they attended an event, and also that this conversion continued to happen over subsequent months.
Look at cohort-based views. You want to see cohorts following a reasonably consistent pattern in terms of the rate at which they convert, and how quickly. Why? If you know when your buyers are naturally converting, that may be a good guide in terms of when to concentrate your efforts around trying to convert more of them. In the example below, the conversion rate is highest in the same month that they bought a ticket, before stabilizing around month 5 or 6, so we focused our efforts on the first months after someone bought a ticket.
If you aren’t yet at a stage or scale where you have this type of data, there are still directional signals you can look for. Just as Roelof at Sequoia did, you can ask customers where they learned about your product, either by directly talking with them or through a survey (e.g. “Where did you first learn about us?”). Sometimes this will also come through in sales conversations where a sales prospect will mention how they interacted with your platform from the demand side first.
If demand-to-supply conversion isn’t happening organically, even as a very small percentage, it probably isn’t right for your network or marketplace.
It’s happening. Time to figure out why—and why not
When you do see this growth loop happening and you want to see if you can increase the rate of conversion, it’s imperative to figure out why, and also why not. Why aren’t more users converting? One of the most important questions to answer is whether or not the demand side of your user base understands your full product offering, namely, how it’s used on the supply side.
In our quest to better understand Eventbrite’s opportunity, we conducted a survey of our attendees. In doing so, we learned that attendee understanding of Eventbrite was not good. For example, about 50% of respondents did not know whether to agree with the statement “Anyone organizing an event can sell tickets through Eventbrite.” If your demand side doesn’t understand the basics, you have little chance to convert them. We then spoke with 20 users who had converted and we tried to understand the reasons they switched over, as well as the barriers they faced along the way. From those interviews, we were able to formulate hypotheses to set the stage for future testing. For example, we learned that many people who had converted from an attendee into an event creator often did so after having attended more than one Eventbrite event. So we formed a hypothesis that focusing our efforts on users who had attended two or more events may be a promising segment to experiment with.
All of these qualitative learnings gave us confidence that helping attendees better understand how Eventbrite works as an events platform could dramatically improve our demand-to-supply conversion rate. So we made it our growth team’s goal to help attendees understand that they can easily organize an event on Eventbrite, and measured our success based on increasing demand-to-supply conversion rate as well as growing the number of new event creators who first started as event attendees on the platform.
Prioritizing focus when leaning into this growth loop
Optimizing for demand-to-supply conversion requires a few basic things. Potential users who may convert to supply need to:
Know who you are
Know what you do and how you help them—the “aha” of your value, specifically in context of the supply-side use case
Keep you top-of-mind when that need arises
I recommend starting with the higher-traffic and/or most contextually relevant parts of your product where your branding and positioning can be improved. There are probably a million different things you could do to try to achieve those sub-goals, so focus on changes that seem most likely to create material changes in the conversion rate. The goal is to convert as many demand users into supply users as possible—so the pages that the demand-side users interact with are a natural starting point.
And in terms of how to improve your branding and positioning, it’s a good idea to listen to your users. Ask users who have converted to the supply side, and use their reasons for switching to draw in new converts. Drawing from our prior user interviews:
“I was seeking a better way than forms and PayPal.” —Kelsey
Messaging to test: “Save time: there’s a better way.”
“As a consumer buying tickets for my kids, I thought ‘This was easy and it worked,’ and that was enough for me to try Eventbrite.” —Ronnit
Messaging to test: “It’s easy. You had a great experience with Eventbrite. So can your own attendees.”
How to measure
It’s tough to experiment without measuring, so let’s start there. In my experience, measuring these efforts to improve buyer-to-seller conversion is not as straightforward as A/B testing a landing page or an onboarding flow. For one thing, we had a fairly long tail in terms of latency of conversion: Just because you’re going to an event today doesn’t mean you have a need to host your own event the next day, and many demand-to-supply conversions happened months or even years after buying their first ticket. To help combat the sometimes long latency in converting, we looked for leading indicators.
To see if we were making progress, we’d look at low-latency cohorts as a leading indicator that we were on the right path as we rolled out improvements or tests. Low-latency cohort analysis involves looking at sets of users who take the key demand-side action (in Eventbrite’s case, buying a ticket) in a given period and then looking at how they convert into the supply side across recent time intervals (could be days, weeks, or months).
Whether you should look at days, weeks, or months depends on a couple factors. One factor is the natural frequency of usage for your product. For a product category like grocery delivery with pretty high natural weekly usage, you might get a lot of signal looking at weekly cohorts (e.g. how many consumers who had groceries delivered in a given week and then converted into a delivery driver within the same week, second week, and so on). Another factor is your product’s scale and whether you have a large enough data set to draw conclusions from daily or weekly data (requires larger scale), or if you’re better off looking at longer-latency but higher volume of data cohorts like monthly or quarterly (requires less scale).
Using a low-latency cohort example from Eventbrite below, we’d look at our demand-to-supply conversion rate for users converting in the same week (e.g. buy a ticket, and then publish an event in the same 7-day period). This is the blue line, or “0 week,” on the chart below. We’d also look at conversion rates for users converting within 14 days (red line: “1 week”) and 21 days (green line: “2 week”). We were looking to see if there was an uptick in the fastest-converting users, as that was often a leading indicator that our changes would drive more sustained lifts in conversion.
To be honest, at times it was not entirely scientific, but we were able over time to measure pre/post lift from our efforts in terms of when we made changes, and if we saw conversion lifts that sustained over time:
Time to start experimenting: learnings from Eventbrite, SurveyMonkey, Airbnb, and more
As I noted above, a core part of the effort here is showing prospective converts who you are (your brand) and what you do (your product’s value). To do so, it’s crucial to emphasize consistent branding and key messaging throughout the demand-side journey. For Eventbrite, most of our traffic initially flowed through our event ticketing pages. Early on, most of these pages had little to no branding, or were so customizable that they ended up looking like “Myspace for events,” making it nearly impossible for people who visited these pages to even know what Eventbrite was. Over time, we shifted to greater consistency, including more prominent branding.
For some products for which the creator/customer is using and promoting your product to their customers (e.g. Patreon, DocuSign, SurveyMonkey, WordPress), I’ve observed a common tension where the creator/customer often wants to promote their branding and downplay/remove your product’s brand, effectively white-labeling your product. This customer desire is obviously at odds with my advice above. When trying to go from minimal to more branding, increase your logo size, or add in key messages and calls to action, do so slowly over time. These changes tend to not be as big of a deal as people think, but they’d likely overreact if you were to make them all at once.
SurveyMonkey is another business that was able to drive meaningful growth through demand-to-supply conversion. One of SurveyMonkey’s most important user journeys is its core demand-side experience: taking a survey. SurveyMonkey used this important demand-side user flow to reinforce: (1) who it is (its brand), (2) what it does (“see how easy it is to create a survey”), and (3) a CTA to actually create a survey (introducing the supply-side funnel to the demand side).
When the survey taker clicks “Done” to submit their survey responses, they see the following page:
Is that the homepage? Nope, it’s the “survey complete” page. What it lacks in subtlety it likely makes up for in effectiveness. I’ve heard from former SurveyMonkey employees that these efforts were highly impactful in dialing up the product’s built-in virality and conversion from survey takers (demand) to survey makers (supply).
Similarly, at Eventbrite, immediately after a person completed their ticket purchase, we used part of the page to message that the platform could be used “to organize events of all kinds! Eventbrite makes it easy to create an event page and manage who’s coming.”
Here’s an Airbnb experiment that I thought was clever. I assume the prospective-guest-to-host messaging flow is a pretty important flow for guests. In the example below, after sending a message to a host on Airbnb, it displays a modal urging you to “list your home in order to pay for your trip” (I didn’t capture the modal, but you get the point). I thought this was pretty smart, as they know you’re planning to be out of your home, so why not use your space to help pay for your trip?
For most marketplaces, product listings pages tend to see the highest traffic of any single page type. Furthermore, the people most likely to participate in your product on the supply side are often the same people who are already using (or will someday use) your product from the demand side. Put these two together, and it makes logical sense to use some of this screen real estate to promote the sell-side experience. Here’s an example from Etsy:
Thrilling, the leading marketplace for quality vintage clothing, helping 20,000+ small retailers digitize and sell their unique products online (disclaimer: I’m an investor), benefits from this viral loop as well. Below you can see a more prominent example of this type of messaging:
Continuing with other high-impact areas of your product that you can use to position your service as being applicable to both the demand and supply side, let’s look at the header and/or primary navigation within your app. Again, your goal is to communicate: (1) “who” you are (your brand), (2) “what” you do (key things the demand and/or supply side should do), and (3) provide a CTA to take those key actions. While this falls into general best practice, it can be supremely beneficial in helping your demand-side users understand that they can also use your platform in a supply-side experience. For websites, the header is above-the-fold, it’s generally on all/most pages of the site, and helps users with not only literal site navigation but also in navigating “what’s this product do?”
Let’s look at an old Airbnb example. I see (1) the “who” in terms of Airbnb’s brand and (2) the “what” in terms of users being able to either find local listings or become a host.
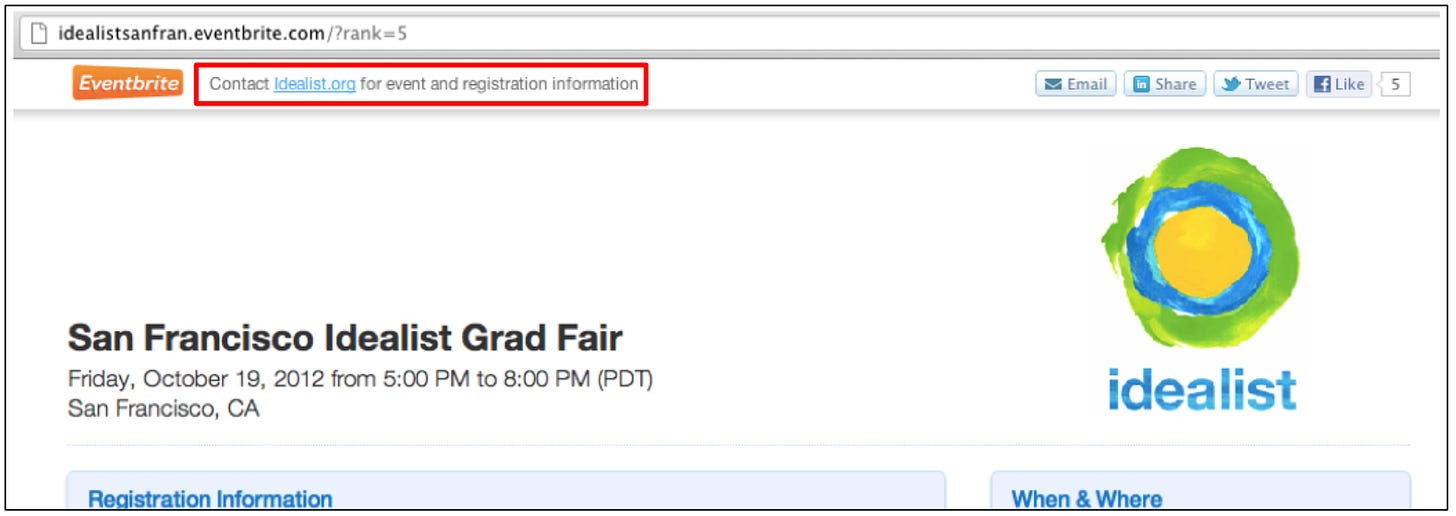
Early on at Eventbrite, we did a pretty poor job of this. For a while we only had a tiny logo with messaging to contact the event organizer directly:
We made this simple header change to “Create an event” or “Find events,” and it turned out to be one of our most impactful changes in terms of both general product understanding and also in lifting demand-to-supply conversion:
If those header changes seem too subtle, check out the old Airbnb experiment that my former growth team colleague Felicia captured:
Beyond the general awesomeness of using a large pop-up with social proof to call attention to “List your space,” I love that Gustaf Alstromer, Airbnb’s former growth product lead, is the first person to show up. How meta is that to show up in your own experiment? :-)
And here’s a native app example where Uber’s rider app is using their primary navigation to call out “Drive with Uber”:
OK, so you’ve got your key user flows and high-traffic areas of your product covered. If you want to keep going from there, think through what other real estate you have.
I mentioned earlier how Eventbrite’s event pages received a lot of traffic. Given that events naturally expire after their date, we had a lot of expired event pages that people would still organically find and continue to visit. We used this as an opportunity to (1) help those users find relevant live and upcoming events (the product experience improved greatly over time relative to the below), and (2) again communicate that they too can use the platform to “create an event.”
In my final example, we even got creative with the paper tickets that people used to download, print, and bring with them to events. When standing in line waiting for an event, why not reiterate that the event-goer can also use Eventbrite to organize their own events?
OK, so we were a little shameless, but it worked :-)
How to get more targeted
Some of the above examples involve pretty broad strokes across large parts of your product and user base. Driving buyer-to-seller conversion tends to be a volume game, but you can and should get more targeted. Segmentation and deeper data analysis can help you home in on driving more impact with the right users at the right times.
Ask questions like:
Who are the users who have a higher propensity to convert? What are their shared attributes, and how are they different from the overall user base?
When are they most likely to convert? Is there a tipping point for users to convert?
Are users who do convert high-value or lower-value? If low-value, is it worth the investment?
At Eventbrite, we looked at the data for predictive markers of the “aha” moment when buyers were converting at a higher rate.
We found a point where this conversion rate jumped by many multiples. This was a pretty good signal to focus on this point within the user journey, and we piled our efforts into doing so.
Another insight I’ve heard from multiple more horizontal marketplaces is how cross-category usage often drives the aha moment of “Oh, I can sell almost anything on this platform!”
So for example, a first-time buyer who googles “handmade necklace,” finds Etsy, and purchases a piece of jewelry, may think, “I’ve bought on Etsy. They sell handmade jewelry.”
Whereas when that same buyer later receives a link from a friend to a handmade toy on Etsy, they experience the “aha” that Etsy sells all kinds of handmade items.
I have seen and heard multiple examples of cross-category purchase/usage being an unlock in terms of the demand side understanding the breadth of offerings, and thereby that the platform is more accessible to many/all categories and different use cases.
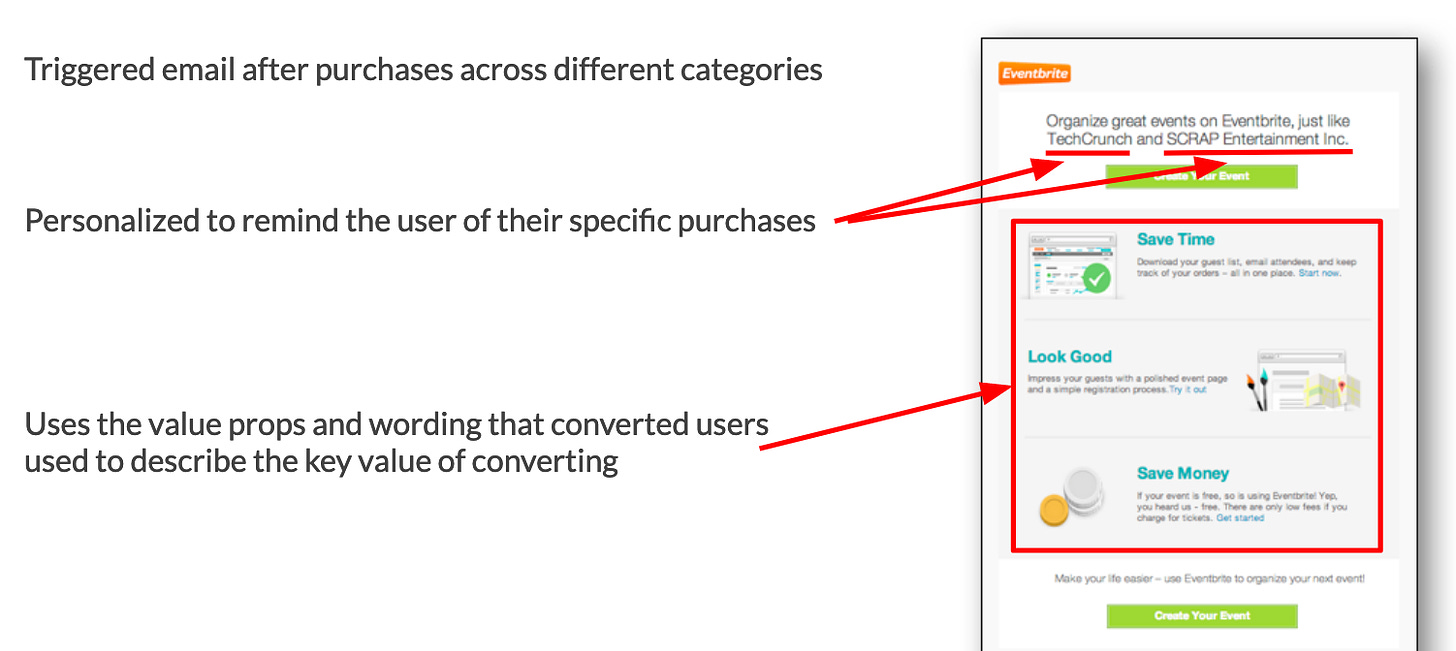
Putting together the ideas from the above examples, at Eventbrite we created programmatic emails that went out to users right when they crossed the aha moment that we had uncovered in the data. Furthermore, we personalized the emails to each user, reminding them of the events they had previously bought tickets for. And then we tested different value propositions and wording, often using the exact words that prior users who had converted used to describe the key value of converting.
Deeply understanding your users’ behavior can help you make additional optimizations, whether that be through more targeted and personalized notifications or well-timed calls to action.
In closing
If it’s naturally happening in your product, demand-to-supply conversion is your friend. When you find it, embrace it. At Eventbrite, through sustained iteration we more than tripled our demand-to-supply conversion rate, and in doing so were able to unlock material organic growth for the business. Many of the great marketplaces of our time have used and leaned into this growth loop to accelerate their journey toward building iconic billion-dollar businesses. I hope this guide helps you on your journey as well.
Are you seeing this demand-to-supply growth loop emerging in your startup? Let me know!
Thanks, Brian!
🔥 Featured job opportunities
Mynd: Senior Growth Product Manager (Remote-US)
Mynd: Product Lead, Internal Tools (Remote-US)
CHPTR: Founding Back-End Engineer (Remote-US)
Permutive: Senior Product Manager (NYC)
CloudTrucks: Product Manager-Console (Workflows & Automations) (SF)
Fairchain: Software Engineer, Full Stack (NYC)
HomeLight: Senior Product Manager, Listing Management (SF, Phoenix, Seattle)
Perfect Recall: Founding Fullstack Engineer (Waterloo)
Spatial: Backend Engineer (Remote-US)
Maven: Product Lead (Remote-US)
Republic: Product Manager (NYC, Remote-US)
Browse more open roles, or add your own, at Lenny’s Job Board.
How would you rate this week's newsletter? 🤔
Legend • Great • Good • OK • Meh
If you’re finding this newsletter valuable, consider sharing it with friends, or subscribing if you haven’t already.
Sincerely,
Lenny 👋











Hi Lenny, great post again, thank you so much!!
Is there an alternative solution for creating this loop without branding since this might not work for any B2B, B2B2C or API product